 Easy Budget Meals
Grocery Price Book: Track the Prices That Matter
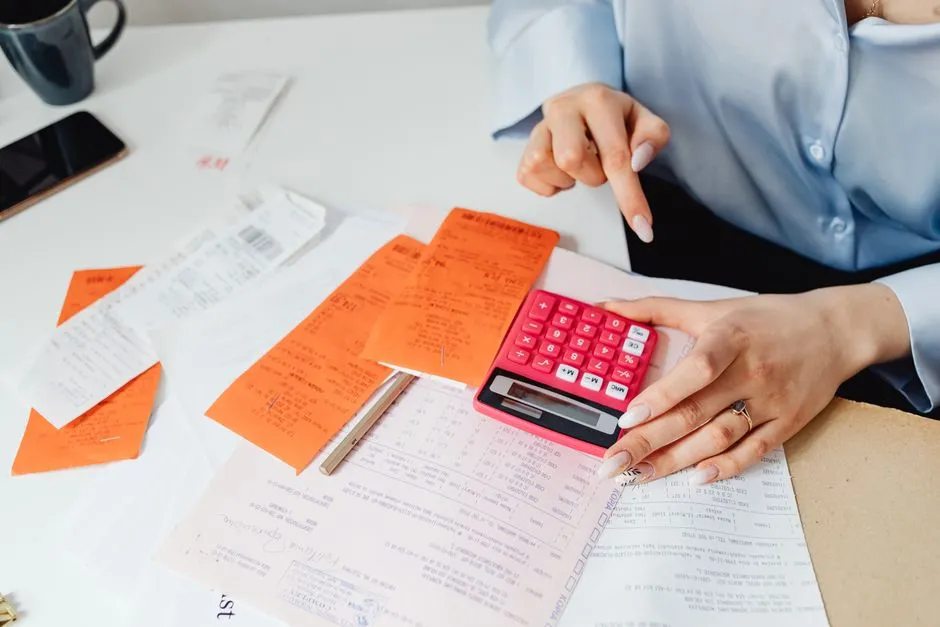
- A grocery price book replaces sale signs with evidence
- What to put in the price book
- Step 1: choose the foods worth tracking
- Step 2: pick one useful comparison unit
- Step 3: record conditions, not just the large number
- Step 4: gather data without adding shopping trips
- Step 5: calculate your three price levels
- Step 6: decide how much to stock up
- Compare package sizes with usable quantity
- Use the price book during meal planning
- A minimal spreadsheet setup
- Common mistakes
A grocery price book replaces sale signs with evidence
A grocery price book is a simple record of what you pay for the foods you buy repeatedly. Track the date, store, item, brand or tier, package size, shelf price, unit price, and any sale conditions. After several shopping trips, each staple gets a normal price, a genuinely good price, and a stock-up price. That history lets you recognize a deal without trusting the fluorescent tag to do the thinking.
Start with 15 to 20 items that materially affect your bill—perhaps milk, eggs, oats, rice, beans, bread, chicken, cheese, frozen vegetables, coffee, and household essentials. Recording every cinnamon stick and emergency lime turns a useful tool into unpaid data entry.
What to put in the price book
A notebook, phone note, or spreadsheet all work. Use one row per observed product and these columns:
| Field | What to record |
|---|---|
| Date | The shelf or receipt date |
| Store | Include location if branches price differently |
| Item | A consistent name such as “rolled oats” |
| Brand/tier | Store brand, national brand, organic, or another meaningful distinction |
| Package size | Weight, volume, or count |
| Shelf price | Price before coupons unless a coupon is noted separately |
| Unit price | Cost per ounce, pound, count, or other useful unit |
| Sale terms | Membership, digital coupon, quantity, limit, or end date |
| Quality/use note | “Freezes well,” “family dislikes,” or “spoils before finished” |
The quality note matters. A food nobody will eat does not become economical when the unit price drops another nickel.
Step 1: choose the foods worth tracking
Look at four recent receipts and circle items bought repeatedly or responsible for large totals. Begin there.
Good candidates have at least one of these traits:
- bought weekly or monthly;
- large swings between regular and sale price;
- several competing package sizes;
- easy to store or freeze when discounted;
- expensive enough that comparison matters;
- often bought under time pressure.
Skip one-time holiday products and ingredients purchased once a year unless they meaningfully affect the budget. The book should answer common shopping decisions quickly.
The store-brand versus name-brand guide can help define separate comparison tiers. Do not mix a basic store-brand entry with a premium organic entry and conclude one store is always cheaper; decide whether those products are acceptable substitutes first.
Step 2: pick one useful comparison unit
Unit price is package price ÷ package quantity.
Use the same unit for every version of an item. Compare oats per ounce, eggs per count, meat per pound, and paper goods per sheet only when sheet size and ply are meaningfully comparable.
Example: milk
A 128-fl-oz gallon at $3.84 costs $3.84 ÷ 128 = $0.03 per fluid ounce. A 64-fl-oz half gallon at $2.24 costs $2.24 ÷ 64 = $0.035, or 3.5 cents per fluid ounce.
The gallon is cheaper per ounce by 3.5 - 3 = 0.5 cent. But if 40 fl oz of the gallon spoils, the household consumed only 88 fl oz. The effective cost becomes $3.84 ÷ 88 = $0.043636..., or about 4.36 cents per consumed ounce. The smaller carton then wins in practice.
Example: cereal package sizes
A 12-oz box at $2.64 costs $2.64 ÷ 12 = $0.22 per ounce. An 18-oz box at $3.42 costs $3.42 ÷ 18 = $0.19 per ounce. The larger box saves 3 cents per ounce if both products are genuinely comparable and the larger one will be finished.
Keep the unrounded result in a spreadsheet and display two or three decimal places. Early rounding can distort close comparisons across a large quantity.
Step 3: record conditions, not just the large number
A price available only with a membership, digital coupon, required quantity, subscription, or rebate is not the ordinary shelf price. Put the condition in its own field.
For example, “$2.49” might mean:
- $2.49 for anyone buying one;
- $2.49 only after a digital coupon;
- $2.49 each when buying five;
- $4.98 now with $2.49 returned later;
- $2.49 for the first two, then regular price.
Those offers have different cash, quantity, and effort requirements. Record the out-of-pocket price and any later rebate separately. A rebate not submitted is not savings, so record it separately until it is received.
For buy-one-get-one-free, divide the total paid by the combined quantity only if you will use both. If two 18-oz packages cost $3.42 total, the combined size is 2 × 18 = 36 oz, and the unit price is $3.42 ÷ 36 = $0.095, or 9.5 cents per ounce.
Step 4: gather data without adding shopping trips
Build the book during normal life:
- Enter prices from receipts after each trip.
- Photograph shelf tags for tracked items you did not buy.
- Check store apps or weekly ads before planning, noting when prices are pickup-only or membership-only.
- Update a handful of items each week rather than auditing the entire store.
Receipt descriptions can be cryptic, so add package size before throwing away packaging. When tax treatment varies, decide whether your comparison uses pre-tax shelf price or final paid price and stay consistent.
Do not count fuel, travel time, or delivery fees as zero when they change the decision. A second store might save $2 on groceries and cost more than that to reach. Track trip-level fees separately rather than smearing them across one can of beans.
Step 5: calculate your three price levels
After six to twelve observations across several weeks, assign:
- Normal price: what you commonly see and can pay without urgency.
- Good price: low enough to move the item into this week's plan.
- Stock-up price: near the bottom of your observed range and worth buying ahead when storage and cash allow.
These are personal thresholds, not national facts. If your recorded prices for a staple are $3.29, $2.99, $3.19, $2.49, $2.99, and $2.79, you might treat about $3.00 as normal, $2.79 as good, and $2.49 as stock-up. Another region or brand tier may produce completely different numbers.
Do not set thresholds from the highest “regular” price printed beside a sale. Set them from what you have actually observed.
Review levels every few months or after a lasting market shift. A price book should change when the observed market changes.
Step 6: decide how much to stock up
Buying ahead saves money only when four conditions hold:
- The unit price is genuinely low in your record.
- The product will be used before quality or safety declines.
- You have suitable storage.
- The purchase fits today's cash budget.
Use this formula:
stock-up quantity = amount used before next expected sale - amount already on hand
If a household uses one jar every two weeks, a sale cycle appears roughly every eight weeks, and one jar is already in the pantry, expected use is 8 ÷ 2 = 4 jars; the stock-up quantity is 4 - 1 = 3 jars.
That is a planning estimate. If consumption varies or the next sale is uncertain, buy less. Running out is inconvenient, but excess stock also ties up cash and space.
Compare package sizes with usable quantity
Suppose a 5-lb bag of rice costs $7.20 and a 2-lb bag costs $3.20. Convert pounds to ounces:
- 5 lb is
5 × 16 = 80 oz;$7.20 ÷ 80 = $0.09per ounce. - 2 lb is
2 × 16 = 32 oz;$3.20 ÷ 32 = $0.10per ounce.
The large bag saves 1 cent per ounce. If the household uses 40 oz before quality or pest problems arise, the theoretical saving on that quantity is 40 × $0.01 = $0.40. Decide whether storage and upfront cash justify forty cents, not whether “family size” sounds virtuous.
For meat, compare usable edible weight when bone, skin, trimming, or cooking yield differs substantially. That calculation requires a measured household yield, not a universal percentage invented for convenience.
Use the price book during meal planning
Before writing the week's meals:
- mark items at good or stock-up prices;
- check what is already open, frozen, or near its use date;
- build two or three dinners around genuine deals;
- keep one flexible meal for an unexpected markdown;
- add only the stock-up quantity supported by storage and cash.
This turns “shop the sales” into an actual method. A cheap ingredient still needs a meal and a use date.
Pair the book with the broader tactics in how to save money on groceries. The price record handles when and where to buy; the meal plan handles whether the food gets used.
A minimal spreadsheet setup
Use columns A through I for date, store, item, tier, size, unit, price, unit price, and notes. If size is in column E and price in column G, the conceptual formula is =G2/E2, provided every row for that item uses the same unit.
Add a filter by item and sort unit price from low to high. A pivot table or dashboard is optional. The value comes from consistent observations, not spreadsheet ornament.
Keep a second small table with each item's normal, good, and stock-up thresholds plus the last review date. When a shelf price appears, compare it with that table in seconds.
Common mistakes
Tracking too much: start with 15 to 20 repeat purchases.
Mixing units: convert pounds to ounces or litres to a consistent volume before comparing.
Ignoring sale conditions: record membership, coupon, quantity, and rebate requirements.
Treating bulk as automatic savings: include waste, storage, cash, and actual use.
Comparing products you do not consider substitutes: separate quality or brand tiers.
Never updating thresholds: review when your observations show a durable change.
Chasing pennies across town: compare trip-level cost and time with the basket saving.
A price book does not need perfect data. It needs enough honest local history to answer, “Is this good for us, here, now?” Keep it small, update it during normal trips, and browse more grocery savings when the next “must-buy” tag starts shouting.
Frequently asked questions
What is a grocery price book?
It is a notebook, phone note, or spreadsheet containing the prices you observe for groceries bought repeatedly. Each row records date, store, item, brand or quality tier, package size, price, unit price, sale conditions, and useful notes. Over time it reveals your local normal, good, and stock-up prices, making sale decisions depend on history rather than a retailer's claimed discount.
How many items should I track in a grocery price book?
Start with 15 to 20 products bought often, responsible for meaningful spending, or prone to price swings. Milk, eggs, oats, rice, beans, bread, cheese, coffee, frozen vegetables, and recurring household supplies are common candidates. Review recent receipts to choose yours. Adding every occasional ingredient creates work without materially improving decisions; expand only after the core list is easy to maintain.
How do I calculate grocery unit price?
Divide package price by package quantity and keep units consistent. A 12-oz box at $2.64 costs $2.64 ÷ 12 = $0.22 per ounce. An 18-oz box at $3.42 costs $3.42 ÷ 18 = $0.19 per ounce. Compare ounce with ounce or count with count, and account for usable quantity when waste, bones, trimming, or spoilage materially differs.
How long should I track prices before setting a stock-up price?
Six to twelve observations over several weeks provide a useful beginning, but seasonal products and volatile categories need longer. Set thresholds from prices actually observed, not a store's crossed-out regular price. Review them every few months or whenever the recorded range shifts durably. A stock-up price is personal to your store access, product tier, storage, cash, and rate of use.
How do I record buy-one-get-one-free deals?
Record the total paid, combined quantity, purchase requirement, and whether both units will be used. If two 18-oz packages cost $3.42 total, the combined quantity is 36 oz and unit price is $3.42 ÷ 36 = $0.095, or 9.5 cents per ounce. If the second package will spoil or the deal requires unwanted items, the theoretical unit price overstates real value.
Is the biggest grocery package always cheapest?
No. Calculate unit price, then include waste, storage, upfront cash, and how much the household will use. A 5-lb rice bag at $7.20 costs 9 cents per ounce; a 2-lb bag at $3.20 costs 10 cents. The large bag saves only 1 cent per used ounce. If storage is poor or cash is tight, that small theoretical saving may not justify the larger purchase.